This month's meeting on Thursday the 9th of the Oregon Transportation Commission is jam-packed with interesting things on climate and non-auto mobility. There is too much, in fact, for a single preview. I'm sure others will have interesting things to say.
 |
| Climate and non-auto mobility |
We'll start here with a high-level document, the draft of new Oregon Transportation Plan.
Early in it, in a discussion of "key drivers of change," the way the authors handle two "conflicting trends" does encapsulate a bias that still infects the whole.
| Encourage reduction vs. driving demand |
They write
climate change implications are encouraging a reduction in single occupancy vehicle use. On the other hand, emerging technologies...are driving demand for single occupancy vehicles.
"Encouraging a reduction" strikes a very optional, aspirational, discretionary tone: We'll try, but maybe not very hard. It's the soft science of social psychology. "Driving demand" strikes a different tone of realism and accommodation. It's the hard science of economics and the market.
In this pair and framed in this way, the second is clearly the one to honor.
Throughout the new draft plan, there is not enough on actual policy to reduce driving and VMT. It's still stuck in the theoretical and discretionary realm of "transportation options" and not enough attention given to policies that actually reduce driving, that induce people actually to make the choice not to drive.
Still, there are some hopeful things in it. There's a policy on a better approach to pricing road use, including congestion pricing and carbon charges.| Pricing road use |
It was nice to see language about making "walking, rolling, biking, and transit...competitive with auto travel."
| More detail on multi-modal parity |
And there's even a recognition that trip-end facilities are important, couched in a discussion of "safety."
| Even a nod to better bike parking |
But other areas offer insufficient change.
Our climate and emissions goals call for not just a decline in per capita VMT but in total aggregate VMT, but the plan's authors are not willing to go there yet.
| Still the dodge of per capita VMT |
There's still too much deference to freight. In a discussion there's a carve-out for downtowns: "Even if freight is a lower consideration compared to people walking, rolling, and biking, project-level access needs should still be considered." That's a recipe for omitting bike lanes and crosswalks.
| Still too much deference to freight lobby |
Separately, in the report on Climate Progress, there's also a very interesting set of slides on emissions forecasts. They are hard to interpret, and hopefully there will be more public discussion. They appear to show a dramatic improvement between forecasts generated in 2018 and 2022 for year 2050 emissions.
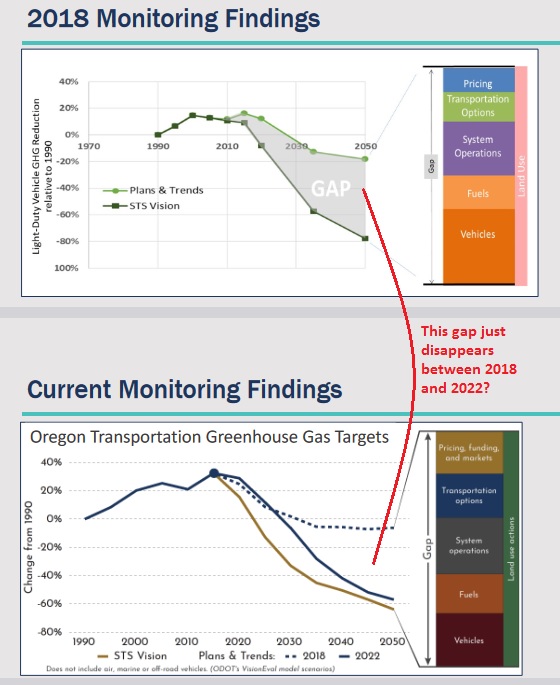 |
| Did we really do that much in four years? |
I find that exceedingly hard to believe, and assume there is some hocus-pocus involved with newly installed and improbable assumptions for magic technology and social change.
 |
| Critique and doubt from Chair Emeritus of the Oregon Global Warming Commission in comments to OTC in January |
Moreover, it is at odds with the letter from the Chair Emeritus of the Oregon Global Warming Commission sent to the OTC in January of this year, just two months ago.
The chart's improvement between 2018 and 2022 just doesn't add up.
 |
| TOC on micro-mobility report |
There are also a report on Electric Micro-mobility and a report on the small grant program. It will be interesting to see how ODOT manages that small grant program. It seemed like a lot of red tape, administrative layer, and high transaction costs for a typical grant of only $5000. That's not even a rounding error on a highway project! In assessment of community-based organization (CBO) grant recipients, they write with understatement:
Accounting for public money, especially federal funds, is time-consuming and requires expertise that relatively few CBOs possess. ODOT’s processes are seen as uniquely difficult to navigate even among state agencies, and resources will need to be dedicated to assisting CBOs in transacting with the agency.
There's the creation of a new fund for responding to crashes and high crash sites: "ODOT plans to invest $5.6 million annually (FY 2025-2027) of HB 2017 State Safety Priority Funds (SSPF) to create the Bicycle Pedestrian Safety Action Program." It may cannibalize funding for other programs, however, and deserves more attention as it may be a political band-aid more than substantive, structural improvement.
There's certainly more to say about all of these, and maybe later this week we'll have another post with more detail on one or more of them. BikePortland seems likely to have news and comment also.
Addendum, March 9th
Though BikePortland did not preview the OTC meeting, on a separate meeting they highlight a key incoherence. When discussing finance and the gas tax, ODOT assumes we will fail to meet our climate goals and do not appear to be aligned with the 2022 forecast. It will be interesting to learn more about this.
 |
| via Twitter |


6 comments:
Our 350.org chapter agrees with many of the points here, and they have the benefit of tying the comment to a formally adopted plan. In written comment to the OTC, they make explicit link to provisions and policies in the Statewide Transportation Strategy of 2013.
Specifically, they note the supposed improvement in emissions in the 2022 forecast is not supported by a public release of a 2022 STS Monitoring Report. Only the 2018 Monitoring Report was public. All the improvement for 2022 is mere assertion without any evidence.
They also note that the draft Oregon Transportation Plan does not sufficiently incorporate recommendations and goals from that 2013 STS.
Interestingly, Portland climate advocates are silent on the plan, perhaps focused on the questions of tolls, on the Interstate Bridge replacement, and on the I-5 Rose Quarter project.
Other comment is on tolling generally, which is not on the agenda, and on State-Federal fund swaps, which also is not on the agenda. Cities and Counties would like to take greater advantage of relaxed requirements on State funded projects. Indirectly tolling could be implicated in this, since ODOT wants to toll not just as decongestion pricing, but to fund highway expansion, and fund swaps could impact that. There are subtexts, and not all of the actual politics are visible.
Added a note on disconnects between budgets/financial modeling and emissions propaganda and greenwash!
Bike Portland posted a piece on an exchange between Bob Cortright of Salem 350 and former Senator and now Commissioner Lee Beyer
https://bikeportland.org/2023/03/10/state-transportation-commissioner-skeptical-odot-can-woo-people-out-of-cars-371225
At the OTC, the Climate Office released their dashboard/website on tracking transportation related emissions. This may address your questions.
https://www.oregontransportationemissions.com/home
Ray
MWVCOG/SKATS
Yeah, I looked at the dashboard earlier, and looked at it again today. Have you looked at it? Do you find it persuasive? It does not seem very rigorous; and does seem full of optimistic spin, even bs at times. Again, two months ago Angus Duncan sent a letter of great concern, and it will be interesting to see what he and others have to say about the dashboard.
RE: the dashboard
I have been looking at the website this morning.
It needs a better way of portraying where the reductions are coming from (without going through each individual page) and what has changed since 2018. The graph on the front page seems to suggest that there is an equal contribution from each of the categories -- which I'm pretty sure is not what they intended.
For example, the DEQ mandates that passenger vehicles sold after 2035 be EVs, combined with a cleaner electrical grid are both changes since 2018. How much do these two factors change the graph?
I'd like to see an interactive graph, where the public can try different scenarios to better understand how these different policy choices influence the end result.
Send your comments/concerns on the website to the Climate Office.
Ray
MWVCOG/SKATS
Post a Comment