Showing posts with label Traffic Modeling. Show all posts

Saturday, April 27, 2024

Surfacing a new Intersection Safety Study at the Budget Committee and More on the CIP

In the agenda packet for the next Budget Committee meeting on May 1st is reference to a new intersection safety study the City had not mentioned publicly before.

These are our busy streets

It's hard to see, however, what it accomplishes.

A new safety study

At a glance from here, it looks like a restatement of the obvious: Streets fast or busy (or both) are dangerous!

Monday, May 22, 2023

350 Salem notes Omission of Induced Demand in Long-Range Plan: At the MPO

The Policy Committee for our Metropolitan Planning Organization meets on Tuesday the 23rd at noon for a formal Public Hearing and then adoption of the 2023-2050 Metropolitan Transportation Plan.

About the long-range plan it has been a struggle to zero in on useful comment. Its project list is long and broad, and it is the short-term plan and that project list that actually instantiates funding decisions. So from here the short-term plan and list has seemed to be the more important document.

Moreover, the long-range plan needs not merely minor fixes to language or other detail, but instead needs a comprehensive revision to bring it into the 21st century. Revision might not be strong enough, in fact. It might need to be completely rebuilt from the bottom up.

However, since there are Federal requirements and other regulatory demands the document must satisfy, this might not be possible. But that's what it needs. Without that wholesale revision/rebuilding, it's hard to say what might be the most constructive set of edits. Most of the changes just seem like tinkering on the edges.

Here are a couple of higher level themes others have expressed.

Our 350.org chapter highlights the ways the document still fundamentally fails to account for induced demand and climate. They "object strongly to the emphasis in the draft MTP on expanding capacity of existing roadways. Study after study shows that road widening does not significantly reduce traffic congestion."

350.org comment on induced demand
(Yellow in original, red added)

Separately, Cherriots commented extensively on the draft and noted the striking absence of transit in the goal statements. A few lines were subsequently added in the most recent draft, but transit as an efficiency measure, as the foundation of multimodalism, and a keystone for emissions reductions and environmental mitigation is insufficiently central. It's still very autoist with transit on the margins.

Striking lack of transit in goals

They also had what might be the single best comment on a bike "facility", about the mess of paths and ramps at 12th, 13th, and Mission: "RU kidding? Is this REALLY in our BIKE system?? Never in a million years would I try to ride my bike on one of those swirly ramps."

Saturday, March 4, 2023

Questions for Traffic Modeling: Climate Action Plan Committee meets Monday

The Climate Action Plan subcommittee meets on Monday the 6th for their bi-monthly session. The change in transportation analysis remains interesting.

March agenda

In yesterday's paper

Transportation Modeling

In the packet is final report on the new emissions inventory on 2021 data, and as we noted in January on the video presentation, it has some important analytical changes. One of them is on transportation.

Revised pie chart on transportation
(yellow highlighting added)

About the change, which purports to use empirical data rather than computer modeling, they say:

The 2021 data used in this report were based on...Google's proprietary location history data....The source for local VMT data in 2016 was the Salem-Keizer Metropolitan Area Travel Demand Model. This model provides a computer-generated estimation of vehicle trips and does not use on-the-ground measured data.

Friday, November 4, 2022

Our CAP calls for Supporting Alternative No. 3 in Cordon-Kuebler Corridor Study

The Cordon-Kuebler Corridor study just opened a second online open house.

There's a lot of detail, but if we take our Climate Action Plan seriously, Salemites should strongly support a framework based on Alternative No. 3.

There are two other alternatives, but they are very much in a 20th century and autoist mode.

Summary cross-sections (red, yellow added)

The framing associated with the third alternative is unfortunate and skeptical: Look at this hard goal we have set. But if you really want to, we can try.

The mode shift goal in the third alternative

But a different framing, one with a climate lens, might say, here is our mode shift goal and VMT reduction goal, which alternative helps us get there?

Look! Our CAP has the same 10% reduction

As it happens, in Scenario No. 1, our Climate Action Plan contains a very similar goal for a 10% reduction in car driving and traffic volume.

Summary assessment on function (red, yellow added)

That is our policy goal, and the framework in Alternative No. 3 is most consistent with that.

We should manage the whole of the Cordon-Kuebler corridor to that goal.

We should adopt some version of Alternative No. 3. That's the nutshell.

Here are some other considerations.

Thursday, June 16, 2022

Forecasting and Youth: Another Avenue for a Citizen Advisory Committee?

The front page story in today's paper is about youth and mental health. 

Mostly it's good to see, but the focus on mental health risked shifting the stress to subjective and individual problems of anxiety and despair away from the objective problem of increasing emissions. The fundamental solution is not better coping mechanisms, but is reduced emissions. Adaptation, and the concomitant fatalism, should be a secondary matter, not primary. It's not just in our heads. It's a corporate and communal problem, not just a personal one.
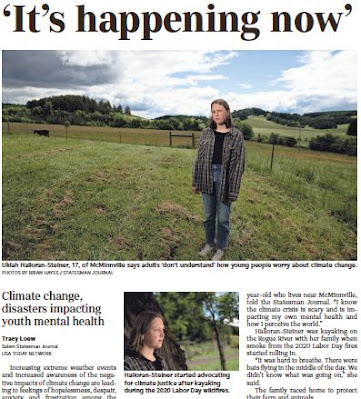
Front page today

Yesterday

Inside were three bulleted recommendations. The lead one was this:

Share power with youth in decision-making about climate and mental health policy and solutions to increase youths’ sense of hope, belonging and agency.
This week at the MPO they were talking about 2050 employment and population forecasts. This is one of the few areas of governance in which we are formally serious about forecasting. We don't directly model and forecast garbage collection, crime and police, and most other municipal services. But we have a strong tradition, even with its false precision, of traffic modeling and forecasting 20 and 30 years out.

At the MPO this week

But the forecasts are numbers only.

In 2050 the teen in the article "It's happening now" will be about 45.  

If the MPO is serious about forecasting (and this would also hold for the City of Salem and our Climate Action Plan), they could consider making it less abstract by adding faces to the numbers, real people for whom the forecasts are made: A Citizen Advisory Committee solely composed of youth, the ones whose futures will be most impacted after today's "adults in the room" are all dead. 

Again, such a committee could just be ornamental, but there's a chance that having to explain things to teens, and having also to answer their questions, polite and impolite, might be a salutary exercise.

Thursday, February 3, 2022

Learn about Induced Demand at Friday Talk

Want to learn more about the current state of research on induced demand?

Friday talk, via Twitter

On Friday the 4th during the lunch hour at PSU they'll have a talk on it. From PSU:

Empirical research shows that expanding roadway capacity induces more driving - the so-called "induced travel" phenomenon. However, environmental impact assessments and cost-benefit analyses of roadway capacity expansion projects have historically ignored, underestimated, or mis-estimated this induced travel effect. As a result, they frequently overestimate the projects' potential to relieve congestion and reduce air pollution. That spurred our team at the National Center for Sustainable Transportation (UC Davis) to develop an online tool to facilitate estimation of induced vehicle travel from capacity expansion projects. This presentation will explain the induced travel phenomenon, introduce our induced travel calculator and its offshoots, and discuss how transportation impact analysis is changing.

PSU usually publishes the video and slide decks afterwards, and we'll try to come back and update here when they go live.

Update: Here is the slide deck and video of the talk.

Saturday, January 22, 2022

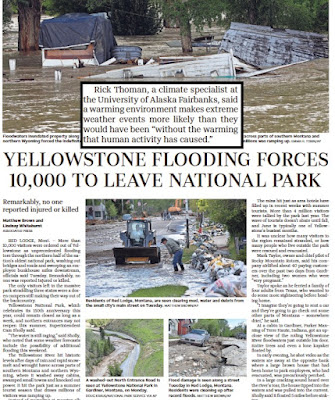
City Council, January 24th - Street Murals and Traffic Modeling

Though there are some big items, like the code update, which we'll get to in a moment, the most interesting item on Council agenda for Monday is another initiative proposed by Councilor Stapleton.

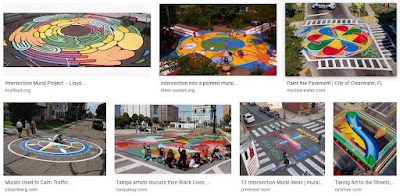
Examples of "intersection murals"

She proposes to "direct staff to create a proposal to establish a Street Mural program for Council’s consideration and adoption."

Over the past year or so I’ve been trying to find ways to elevate neighborhoods and bring a sense of community and beauty to the City. I believe that a Street Mural program, much like we see in other Oregon City’s, would be a wonderful addition to our neighborhoods. These works of art are designed, installed and maintained by the local community and bring a sense of pride and placemaking to an area. With these installations folks can easily express the culture and/or history of a place or highlight what makes their area of town a wonderful place to be. Beauty is not only for museums, parks or public buildings, it also belongs in the heart of our neighborhoods for all to enjoy.

See this Project for Public Spaces discussion from 2015 for more on the concept. Salem Reporter also has a piece about it, and compares this new proposal a little to the considerably more complicated process for murals on building walls. It says Belmont and Cottage in the Grant Neighborhood would likely be the first site for a street mural. 

It is an interesting intersection. On one of the corners is the Roth House, associated with an earlier grocer named Roth (not the current one who just sold). Downtown the Roth building is incorporated into the McGilchrist building. The intersection also has had an empty lot on one of the corners. Though the Grant Neighborhood has opposed gentle upzoning and middle housing, this kind of place-making could calm traffic and also show demand for incremental increases housing and housing type.

In many ways this is a great idea and deserves strong consideration.

Related to Our Salem, and separate from the code amendments, there is a transportation related amendment to the criteria for a major, City-initiated comprehensive plan map amendment. It is in two agenda items, a Public Hearing, and a Second Reading for enactment.

The Salem Transportation System Plan, Street System Element, Policy 2.5, establishes the performance standards for operation and design of City streets. This includes the provision that the City shall allow its existing streets and intersections to function at a Level of Service (LOS) E, which is the LOS at which traffic volumes generally are approaching or at 100 percent of the street’s effective capacity.

The code amendment proposed in Ordinance Bill No. 17-21 establishes a threshold for when a major plan amendment would fail to meet this adopted performance standard. The Regional Travel Demand Model is a broad model of transportation performance and as such, has a lower level of precision than would be provided through a more detailed and focused traffic engineering analysis. To account for this and for the associated margin of error embodied in the Regional Travel Demand Model, code language is proposed to define when a transportation facility would fail to meet the defined performance standard as follows:

(ii) Determining significance. For the purposes of determining whether a proposed major plan map amendment will degrade the performance of an existing or planned transportation facility for OAR 660-012-0060(1)(c)(C) and (D), the following will not be considered significant:

  • (aa) The plan map amendment increases average daily trips on a facility by fewer than 200 daily vehicle trips, or
  • (bb) The calculated volume to capacity ratio with proposed plan amendment is within 0.03 of the volume to capacity ratio with existing plan map designations.

Working within the LOS paradigm, this seems like a reasonable adjustment.

Monday, April 26, 2021

Beefing with the Population Research Center: Forecasting at the MPO

The Policy Committee for our local Metropolitan Planning Organization zooms on Tuesday the 27th, and they will be asked to sign on to a letter containing a critique of the latest population forecasts from the Population Research Center at PSU.

This might seem like a minor technical matter, but the memo paints it as a big deal, and from here the problems are emblematic of and ingredient in the way our transportation planning is pretty messed up. 

The agenda item: forecasts look too low

In more detailed memo inside the meeting packet, MPO staff say that the new forecasts issued this year show, relative to the last forecast from 2017, a "sharp decrease in growth projections" and this delta, this change, they "find...very alarming."

 "sharp decrease...alarming"

Just in neutral terms, sure, a change in forecast is an interesting matter and analysts would be interested in learning more about why there is this change. Trying to understand the change better is, in and of itself, not weird or objectionable.

But why is the lack of growth so alarming? Is there some reason we have to assume greater growth? Strong Towns might say that the "growth Ponzi scheme" depends on outrageous projections of growth, and default planning assumptions for growth might be worth a closer look. Does debt service on bonds and the sales of bonds require these assumptions? Formulas for Federal funding? (And politics and redistricting? What all is at risk in this? If we are adjusting forecasts every 4 years, what gets out of whack over the four year interval?)

There might be an interesting subtext here.

And there is more. A section in the memos talks about the "importance of having reliable forecasts for long-range transportation planning."

Ostensible interest in "reliable forecasts"

Thursday, January 21, 2021

Traffic Modeling and Studies Ignoring Climate: At the MPO

The Policy Committee for our Metropolitan Planning Organization meets on Tuesday the 26th and they'll hear an information report on the Keizer Growth Transportation Impacts Study.

Nothing about climate and emissions here

We haven't followed the City of Keizer much here. A couple of items here and there, but it has also been clear that even with an immediate next door neighbor, there was a body of hyperlocal knowledge, history, and politics that made it difficult to follow things meaningfully without a full commitment to follow things closely. Dipping in and out necessarily meant shallow. Hence, little discussion of Keizer here, and the development of this plan has not been remarked on.

But as the City of Salem finally begins to grapple with a Climate Action Plan, and the State also begins to work out climate policy, there are these local initiatives proceeding blithely and seemingly unawares of the need to reduce emissions and reduce driving.

On the agenda at SKATS is an informational presentation on the Keizer study. The summary describes it as evaluating "the expected magnitude of added vehicular traffic" associated with the "planned expansion of the City's Urban Growth Boundary." (See the Oct 2020 Keizer Planning Commission packet.)

Sunday, November 1, 2020

On Forecasting and Uncertainty

As we all wonder how things will look Tuesday evening and Wednesday morning, and then for the next four years, it is interesting to consider how we handle uncertainty in forecasting and modeling.

Highlighting uncertainty:
A range of outcomes on Sunday morning - via 538

"Mapping uncertainty" - via twitter

One person, formerly involved with fivethirtyeight, writes that the modeling should be understood as "mapping uncertainty rather than making predictions."

In a response on Our Salem on population forecasting, EconNW said:

Whenever I develop a forecast for a city, I tell them that, while we are required to have a point forecast for 20 years, I know the forecast is almost certainly wrong.

Strong Towns devoted a post to a closely related matter, "A Reminder for Planners: 'Every Projection is Wrong'

False precision in the Costco case
(Final written argument on Remand)

So a perennial question here is, why does our traffic forecasting erase uncertainty and give the false precision of one number for 2035 or 2040 traffic or other future date?

Tuesday, May 5, 2020

New Our Salem FAQ Clarifies Some Things, Muddles Other Things

The disavowal of precision in the FAQ rings a little false
with the tables and numbers they actually published
(quote in red from the FAQ with the April version of Indicators)
The City's just published a FAQ ostensibly responding to questions about the scenarios they shared last month.
We've heard from a lot of you as part of the Our Salem project, and we thank you for your input on the different options - or scenarios - for how Salem could grow in the future.

We know there is a lot of information packed into the scenarios and indicators, so we've created a webpage to help answer some of the most frequently asked questions.
If you are unfamiliar with the basic structure, some of the questions might be helpfully explanatory.
Scenarios help us "test drive" different future land use patterns. For example, one scenario shows more new housing on the edges of Salem, while another shows more areas with mixed-use development. By having multiple scenarios, we can test different ideas in the community to better understand what people like and dislike.

Scenarios also help us know how different land use patterns could impact things like the environment, housing affordability, and how people travel around the community. This is done through a planning model that our consultants use called Envision Tomorrow.

Ultimately, the scenarios will help us develop the vision for future growth in the Salem area. This vision will include a map of how we want to grow as well as priorities that guide our growth.
But on some of the more technical details they talk around the matter.

Saturday, March 7, 2020

New Report on Induced Demand Critiques our Errors on Congestion and Budgets

This past week Transportation for America published a report on induced demand, "The Congestion Con: How more lanes and more money equals more traffic."

I didn't look at it promptly because I figured it was about big cities.

And it was about them. It found that in the 100 largest "urbanized areas" they increased highway lane-miles by 42% when population increased only 32%. But a measure of congestion found delay grew by 144%!

More lanes isn't offering faster speeds and freer flow
But it turns out Salem makes the list. Salem counts as one of the 100. (I just don't think of Salem as this big. But merely as cities - not the larger "urban areas" - Salem and Eugene hover around #150 on the list right now.)

Tuesday, January 21, 2020

Study on Traffic Forecasting Urges Embrace of Uncertainty

Last week in a note about the Technical Advisory Committee at the MPO, I appended a brief note about a study on a favorite topic, "Traffic Forecasting Accuracy Assessment Research" from the Transportation Research Board.

That's a bell-ish looking curve with a bias to the left
The note was too brief, it needed follow-up, and a reader even offered a cranky comment in the absence of more discussion. The comment is dismissive and I am not sure it was offered in good faith, but I will use it here as a jumping off point.
What I find extremely funny about this post is adding a graphic from the city that forecasts biking and walking in 2035 and accepting it as a fact or accurate prediction,* but in the same post adding a graphic to show that model forecasts are not accurate but instead have a distribution (everyone who does forecasting knows this, its not a revelation!!!)

It appears that the author likes to rely on forecasts when it fits their viewpoints and biases, but rebuke forecast when it doesn't!

BTW - that bell-shape forecast distribution show that the majority of forecasts are within 20% plus or minus of the actual future volumes. I have no problem with that level of accuracy. How many people do you think can predict the Dow Jones Index 20 years from now within 20% +/-??
One reason the comment does not seem to be offered in good faith is that its assumed audience is a fellow forecaster or someone with similar knowledge. Of course "everyone who does forecasting" knows about a distribution on forecasts. Here I am not concerned with professional, guild knowledge addressed to other professionals. This kind of insider talk is not the issue. The relevant issue here is the outward-facing information, what public and electeds "know," and they see only a single number in a forecast.

Here is a forecast from the SRC, for example. (You can read a longer discussion of it, with references, here.)

2040 counts from a January 2019 SRC report
If those who generated the forecast understand there is a distribution and margin of error, they have hid it. The forecast as it was presented to City Council is full of false certainly and precision.

The claim here, is that this kind of forecast needs visible statements of uncertainty.

Monday, January 13, 2020

Reviving Interest in Bike Counts: At the MPO

The Technical Advisory Committee for our local Metropolitan Planning Organization meets on Tuesday the 14th. There is no great substantive matter on the agenda, but maybe a few things to note in passing.

Are we going to get serious about bike counts?!
(Minutes from the last meeting)

2008 bike count map
(not in meeting packet)
In the heady days of the late aughts and early teens, it seemed like we were in the middle of a fourth bike boom and that this one would have traction, would blossom into broader transportation change, and that bike subcultures would grow into the wider culture. Part of that optimism was an attempt at an annual volunteer bike count project.

(Here are reports on the 2008 and 2011 counts, and all notes on bike counting.)

In the trivial sense that the count project generated data, it was successful. But it was difficult to sustain in an on-going way. The City did not seem very interested in using the information to leverage more bike lanes or inform transportation planning. It remained very fringey. The struggle to adopt the TSP update, "Bike and Walk Salem," was also dispiriting. And of course the City's focus on the SRC revealed their real priorities.

So the count project just seemed like wheel-spinning and something ornamental for "box-checking" purposes. Without progress and real enthusiasm from the City, it was difficult to retain volunteers. Volunteers need to have purpose and to feel useful! Why are they giving their valuable time and effort?

Wednesday, August 14, 2019

I-5 Chemawa Interchange Plan at OTC This Week

The Oregon Transportation Commission meets in Ashland this week, and on the consent calendar is the I-5 Chemawa/Lockhaven interchange.

Formally it's a "Resolution to amend the Oregon Highway Plan and adopt the Interstate 5 /Chemawa Road Interchange Area Management Plan and Alternate Mobility Targets."

This process has been percolating for several years now (see the December 2012 date on the plan, for example), and it's late to have much to say. The plan mostly concerns Keizer, also, and following the City of Keizer closely has generally been beyond our scope here. So this is "Johnny come lately" for sure. You may know much more about the plan.

Phases for the preferred alternative (click to enlarge)
From an urban standpoint, widening Lockhaven, extending Verda Lane and Tepper Drive, seem like the big pieces. Both these and the highway widening would induce trips, also, and should be seen as inconsistent with greenhouse and climate goals. But of course that's not how ODOT rolls, and probably not how Keizer rolls. The "auxiliary lanes" for the highway at least superficially resemble those in the I-5 Rose Quarter project, and it would be interesting also to learn if Chemawa School has any concerns about increased particulates.

Saturday, August 10, 2019

City Council, August 12th - More on Salem Heights

Apart from the questions about bus stops and parking removal, the other item of real interest here on Council's agenda for Monday is the continuation of the appeal of a 34-lot development off of Salem Heights. (Previous notes here.)

Much of the protest and criticism of the development is a proxy for neighborhood dissatisfaction with speeding on the current "unimproved" state of Salem Heights as a rural-ish road without sidewalks and bike lanes.

In the rebuttal materials, the consulting traffic engineer talks about speed. And there is a real problem here. "Speed data alone is not evidence of a safety problem," they write. Because the crash rate here is below average, they conclude the corridor is "safe."
15% of drivers go well over the posted 25mph here
This is balderdash!

This is a structural blind spot in our traffic engineering. It ignores the number of people who choose not to walk or bike or even drive on the street because they feel unsafe. There is a subjective element that has been completely erased in our hydraulic autoism and the attempt to model traffic after fluid dynamics and physical sciences. People in cars feel safe enough to speed. The definition of safety has a strong autoist bias here.

The consulting engineer goes on to say,
...even if the existing speeds on Salem Heights Avenue S were deemed to constitute a documented traffic problem, the proposed subdivision would need to contribute to the traffic problem in order to trigger the need for a Traffic Impact Analysis.
They are right that the proposed development is too small to trigger the TIA, the north-south connections will be a benefit, and the neighbors are misdirecting their fire.

Still, there is a problem here, but it's not the development. Speeding on Salem Heights is a real problem, and the City should face this squarely. Slow the cars.

Additionally, the neighbors have proposed traffic diversion on one of the streets, allowing for walking and biking through, but denying car travel through it. City Staff seem to be very resistant. This is a concept we need to talk more about. Maybe here is not the right place for it exactly, but more generally, if we are going to start taming cars, we will need more diversion to prioritize non-auto travel. The City should take this suggestion more seriously.

Final pie chart from Our Salem: It's all about the cars
Also on the agenda is an "Intergovernmental Agreement with the State of Oregon, Office of the Fire Marshal for Regional Hazardous Materials Emergency Response."

Saturday, June 8, 2019

City Council, June 10th - Crosswalks

There's a cluster of interesting transportation items on Council agenda for Monday.

Most interesting is the report from the Crosswalks committee.
The City of Salem Pedestrian Safety Study was conducted in response to a spike in pedestrian fatalities in 2015. Completed in March 2018, this study evaluated the various causes of pedestrian crashes, identified trends and patterns, and developed a set of recommendations aimed at reducing the frequency and severity of pedestrian crashes. Among the recommendations from the study was for the City to develop a “Safer Crossings Program” (Program). The purpose of the Program is to establish an objective, request-driven process to evaluate pedestrian crossings and rank potential safety improvement projects at the crossings.

Staff worked with a Project Advisory Committee between October 2018 and February 2019 and developed 12 weighted criteria for ranking potential safer crossings projects. Once the Program is fully implemented, users will be able to propose crossing projects online and see how all of the submitted projects are ranked. The attached initial list of ranked crossing locations illustrates how various proposed projects scored relative to others. This listing also identifies which crossing projects are proposed to be included in applications for federal funding through the Salem-Keizer Area Transportation Study (SKATS).
Ranked candidate crossing sites by weighted scores (partial list)
Mostly the ranked list looks pretty good; maybe there will be more to say after we've all spent more time with it.

But one element, in a way a small and insignificant detail, but in another way a systemic problem, is worth comment.

Sunday, January 27, 2019

Traffic Modeling and False Precision in the SRC Q and A

The big Q & A on the SRC has several sections that use traffic modeling, but no section on the modeling itself. The document assumes the truthfulness and usefulness of a set of traffic forecasts for 2040.

I want to step back a little and ask some questions about the way we handle the traffic forecasts. Above all, the SRC team, and traffic planners here generally, both in public employment and in private contracting, pretty much everyone involved in traffic engineering, elide the uncertainty around forecasts. If there is any statistical uncertainty around the projections, you'd never know it.

There are also a couple of other ways that planners play fast-and-loose with the forecasting.

Traffic Forecasts Generally Deserve Margins of Error

As we receive the forecasts now - and they are delivered rather ex cathedra - they are full of false precision.

2040 counts from Section 13.c

2040 counts from Section 15.d
All of these numbers should have a 95% or 80% confidence interval on them. Or some other sign of the margin of error and uncertainty.

Monday, January 7, 2019

March 29th first Deadline for Important Walking and Biking Funding: At the MPO

The Technical Advisory Committee for our local Metropolitan Planning Organization meets tomorrow the 8th, and they'll be in the weeds. Most of their topics are pretty technical this month, and there may not be much to say about it. But a couple of things might be worth a brief note.

These are important sources of funding
for walking and biking projects
There's an announcement of the preliminary schedule for administering Federal funds from three programs that are significant sources for walking and biking projects.

Pre-applications will be due March 29th and final applications on June 28th. If you have an important walking or biking project in your neighborhood, let your City Councilor know!
March 29th and June 28th are deadlines
Separately, there is a draft of the 2019-2020 Work Program and list of projects at the MPO, and in the discussion of traffic modeling, there's mention of "validation work."

Saturday, April 28, 2018

Congestion Relief Task Force already Skews to a Preferred Outcome

Earlier this week the Congestion Relief Task Force met and if there was one image that encapsulated its perspective and its peril, the graph of traffic counts on the bridges is a strong candidate.

Terrible increases!!!
A reader already commented on the selection of end-points to make a case for a tremendous growth in traffic. The consultant team says that traffic "has increased 12% from 2011 to 2016, or an average of 2.3% per year."

Well, that's true enough. But is it just a kind of data-hacking to find the most convenient set of facts that supports a preferred outcome? Is there a different observation that is actually more meaningful?

But how should we interpret the data? What end-points to use?
Traffic engineering operates on this model with an assumption that car traffic is always and everywhere increasing.

It's seemingly the natural order of things and we must accommodate it.