 |
| Are we going to get serious about bike counts?! (Minutes from the last meeting) |
 |
| 2008 bike count map (not in meeting packet) |
(Here are reports on the 2008 and 2011 counts, and all notes on bike counting.)
In the trivial sense that the count project generated data, it was successful. But it was difficult to sustain in an on-going way. The City did not seem very interested in using the information to leverage more bike lanes or inform transportation planning. It remained very fringey. The struggle to adopt the TSP update, "Bike and Walk Salem," was also dispiriting. And of course the City's focus on the SRC revealed their real priorities.
So the count project just seemed like wheel-spinning and something ornamental for "box-checking" purposes. Without progress and real enthusiasm from the City, it was difficult to retain volunteers. Volunteers need to have purpose and to feel useful! Why are they giving their valuable time and effort?
 |
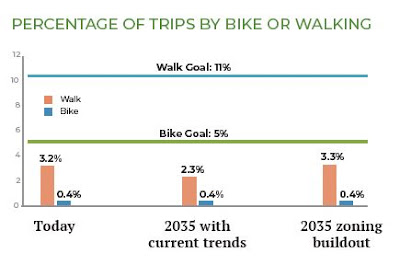
| We weren't close in 2010, and still aren't a decade later; worse, we aren't on track to make the slightest difference in another ten or fifteen years (Our Salem, not in meeting packet) |
Measurement is important, and it's more difficult, even accidental, to make enduring changes to things you aren't measuring. So having a bike count program would be useful. That chart from "Our Salem" uses very limited census data that has a fairly large margin of error. It would be very helpful to have data based on actual counts rather than census interviews or questionnaires.
 |
| One of several charts in a discussion of safety targets in the meeting packet |
We have a lot of statistics on traffic violence. But we just sortof accumulate them, comment on them, and shy away from determined action to change them. They are more ornamental than the basis for policy and action.
 |
| Look at these charts! We have the very best charts! |
 |
| Several of these involve bike facilities |
And there is a note about action on greenhouse gas emissions. The MPO has firmly resisted over the last decade also, and probably they will need pressure to act.
 |
| An email from DLCD on greenhouse gas (yellow in original) |
 |
| Look for the historic sign next to the entry |
SKATS Technical Advisory Committee meets Tuesday the 14th, at 1:30pm. SKATS is at 100 High St. SE, Suite 200, above Table Five 08 and Epilogue Kitchen.
Addendum
Look! Here's a study on a favorite topic. "Traffic Forecasting Accuracy Assessment Research" from the TRB and National Academy of Sciences, Engineering, and Medicine.
Look at that distribution!
 |
| That's a bell-ish looking curve with a bias to the left |


6 comments:
Added chart and link to a study of traffic forecasting. Take-away: Not very accurate.
The link to the document does not work (January 14th at 10 a.m.)
This link takes you to the TRB website to download the document: http://www.trb.org/Publications/Blurbs/179914.aspx
Ray
Thanks! updated the link. (Both that TRB page and a separate National Academy url -
https://www.nap.edu/catalog/25637/traffic-forecasting-accuracy-assessment-research - have the same faulty doi.org link. Not sure why it's broken.)
What I find extremely funny about this post is adding a graphic from the city that forecasts biking and walking in 2035 and accepting it as a fact or accurate prediction, but in the same post adding a graphic to show that model forecasts are not accurate but instead have a distribution (everyone who does forecasting knows this, its not a revelation!!!)
It appears that the author likes to rely on forecasts when it fits their viewpoints and biases, but rebuke forecast when it doesn't!
BTW - that bell-shape forecast distribution show that the majority of forecasts are within 20% plus or minus of the actual future volumes. I have no problem with that level of accuracy. How many people do you think can predict the Dow Jones Index 20 years from now within 20% +/-??
Anon, are you even from around here? The point about the bike/walk "percentage of trips by bike or walking" chart is that we have flatlined since 2010 and are not making changes to have any hope of meeting our target.
You are right that there is a margin of error on the 2035 forecast, but any reasonable margin of error, whether that's +/- 20% or +/-50% is not anywhere close to the goals, those lines on the chart. +/- 50% on a 0.4% bike forecast only gets to 0.6% at most - far, far from the goal of 5.0%. The magnitude of miss, a full factor of 10x, is so far beyond any margin of error that margin of error rounds to zero in the delta.
The argument, then, does not depend at all including a margin of error in the forecast.
As has been developed in previous posts, which you have not read apparently, the beef with traffic forecasting is not that there should be no margin of error with them. There is no expectation for perfection. The beef is that forecasters do not highlight the margin of error in analyses presented to the public and to electeds. They give one number, not a range and confidence interval. So electeds make multi-million dollar funding decisions based on ignorance about the margin of error.
Posted a much longer note on the TRB piece about traffic forecasting. It does a better job of responding to Anon than the comment here. If you want to comment further on traffic forecasting and the probability that actual traffic counts will hit the forecast, click on over to that post please and comment there.
Post a Comment