 Over the weekend Minto Park was closed again.
 The high water was also a chance to revisit the Minto Bridge and Path locations to see just how much they'd be impacted.
 Here's a view from Riverfront Park looking along the probable bridge alignment to the berm on which the bridge would land. It's flooded on either side.
 Happily, the City agreed that the elevations were uncertain and that high water needed to be given more thought. On Monday the surveyors were out in Riverfront Park.
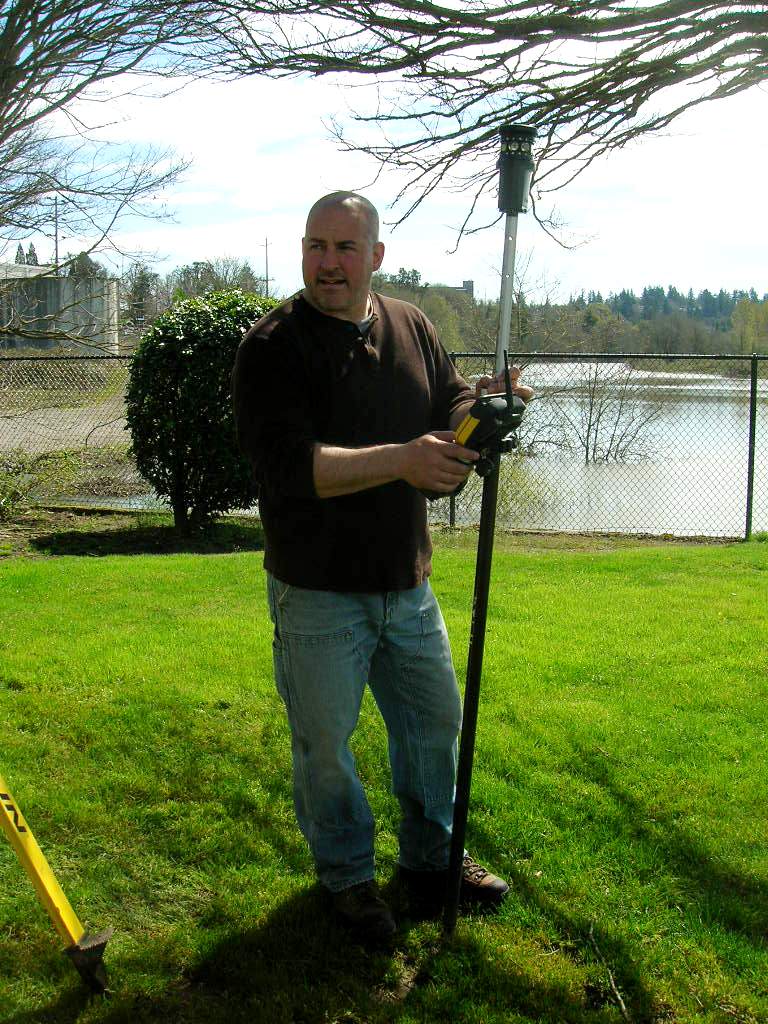 I was able to find out a little more about the elevations and what conditions they found.
 Mostly, it's good news.
On the berm you can see a couple of pink ribbons attached to survey markers (the twig points the way!). With water just over 24 feet, the berm itself is just exposed.
(I expected it to be under water. But the water level also indicates that, contrary to the City's assertion, during the January flooding, the berm was under water.)
The surveyors said the elevation at the marker using the 1988 datum* was about 135 feet, so that means the elevations on the map are most likely from the 1929 datum, not the 1988 datum.
That's a difference of 3 or 4 feet (the point marked 131.88 was surveyed at about 135).
 Rather than trying to put a new set of chicken scratches on the bridge and path elevation drawing, it seems best to wait. It's become clear that the City's not very sure about the elevations and calculations, either. Now that the City will have a clean survey, once these results are published it will be much easier to assess the City's analysis.
 In the mean time it remains an open question - for how many weeks each year will the proposed path and bridge system be closed because of high water? Even though the berm is higher than I feared it was, I still think that the path system will be closed for significant stretches during high water events, and that a larger number of high water events will impact the path system. But now we'll have data!
(Top closure image: Statesman Journal)
* Each datum, the 1988 and 1929, is a zero point, and they differ by a little over 3 feet. There are also three river gages. Or maybe it's three different datum and two gages. Here's the correlation. I'm not sure the City has it figured out!


No comments:
Post a Comment